Using gicentreUtils Library
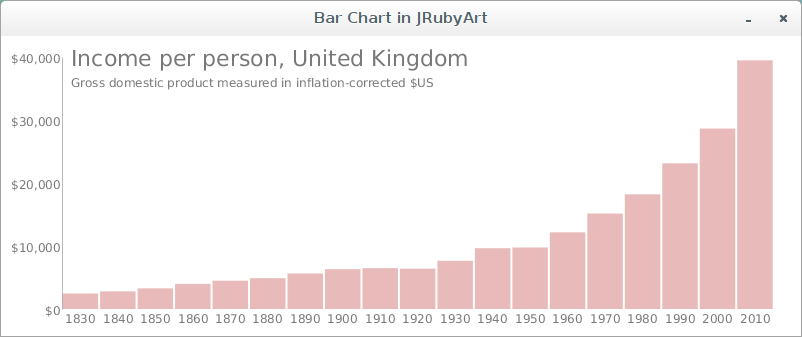
Here is an example sketch by Jo Wood, that has been refactored for JRubyArt. Install the gicentreUtils library from the processing-3.2.1 ide. Demonstrated in this sketch, is how to specify utf-8 encoding and frozen string pragma, getting ready for JRuby-9.1.0.0. Also note that instead of using the egregious java get/set pragma eg setBarGap etc in ruby we can use the much nicer bar_gap = to set values, and use snake case see setup.
bar_chart.rb
# encoding: utf-8
# frozen_string_literal: true
load_library :gicentreUtils
include_package 'org.gicentre.utils.stat' # For chart classes.

# Demonstrates the use of the BarChart class to draw simple bar charts.
# Version 1.3, 6th February, 2016.
# Author Jo Wood, giCentre. Translated to JRubyArt by Martin Prout

# --------------------- Sketch-wide variables ----------------------
attr_reader :bar_chart, :title_font, :small_font

# ------------------------ Initialisation --------------------------
LEGEND = 'Gross domestic product measured in inflation-corrected $US'.freeze
TITLE = 'Income per person, United Kingdom'.freeze

def settings
  size(800, 300)
  smooth 8
end

def setup
  sketch_title 'Bar Chart in JRubyArt'
  no_loop
  @title_font = create_font('helvetica', 22)
  @small_font = create_font('helvetica', 12)
  text_font(small_font)
  @bar_chart = BarChart.new(self)
  bar_chart.data =
    [
      2_462, 2_801, 3_280, 3_983, 4_490, 4_894, 5_642, 6_322, 6_489, 6_401,
      7_657, 9_649, 9_767, 12_167, 15_154, 18_200, 23_124, 28_645, 39_471
    ].to_java(:float)
  bar_chart.bar_labels =
    %w(
      1830 1840 1850 1860 1870 1880 1890 1900 1910 1920
      1930 1940 1950 1960 1970 1980 1990 2000 2010
    )
  bar_chart.bar_colour = color(200, 80, 80, 100)
  bar_chart.bar_gap = 2
  bar_chart.value_format = '$###,###'
  bar_chart.show_value_axis(true)
  bar_chart.show_category_axis(true)
end

# ------------------ Processing draw loop -------------------

# Draws the graph in the sketch.
def draw
  background(255)
  bar_chart.draw(10, 10, width - 20, height - 20)
  fill(120)
  text_font(title_font)
  text(TITLE, 70, 30)
  vertical_spacing = 30 + text_ascent # add the current text height
  text_font(small_font)
  text(LEGEND, 70, vertical_spacing)
end
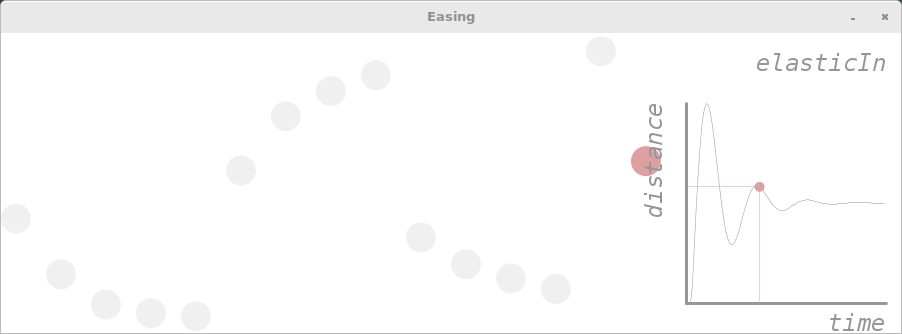
easing.rb
Here is another interesting example sketch using the library
load_library :gicentreUtils
java_import 'org.gicentre.utils.move.Ease'

# Sketch to demonstrate the use of easing methods to control non-linear
# animation sequences. Animates a sequence of discs between the bottom and top
# of the widnow each using a different easing function. Shows a graph of time
# against distance from the bottom of the window. Use the left/right arrow keys
# to select a different easing function and up/down arrow keys to control
# animation speed. Space bar pauses or unpauses the action.
# Each static method in the Ease class takes a value between 0-1 and returns a
# new value also between 0-1 that can be provided to the lerp method for
# non-linear interpolation.
# Version 1.5, 6th February, 2016.
# Author Jo Wood, giCentre. Translated to JRubyArt by Martin Prout

# ------------------ Sketch-wide constants / variables ------------------

RADIUS = 15      # Size of animated discs in pixels.
GRAPH_SIZE = 200  # Width and height of graph in pixels.
LINEAR = 1
SIN_IN = 2
CUBIC_IN = 3
QUARTIC_IN = 4
QUINTIC_IN = 5
SIN_OUT = 6
CUBIC_OUT = 7
QUARTIC_OUT = 8
QUINTIC_OUT = 9
SIN_BOTH = 10
CUBIC_BOTH = 11
QUARTIC_BOTH = 12
QUINTIC_BOTH = 13
BOUNCE_OUT = 14
ELASTIC_IN = 15

attr_reader :t # represents time scaled between 0-1.
attr_reader :t_inc # is the change in time in each animation frame.
attr_reader :ease_style # Stores which form of easing is currently highlighted.
attr_reader :is_paused # Pauses or unpauses the animation.
attr_reader :origin
# ------------------- Initialisation ---------------------

Vect = Struct.new(:x, :y)

# Initialises the window in which animated discs and graph are shown.
def settings
  size(900, 300)
end

def setup
  sketch_title 'Easing'
  no_stroke
  text_font(create_font('Monospace.italic', 24))
  text_align(RIGHT, TOP)
  @t = 0
  @t_inc = 0.008
  @ease_style = LINEAR
  @is_paused = false
end

# ------------------ Processing draw --------------------

# Animates the discs and shows the graph of the selected easing function.
def draw
  background 255
  # Increment t (time) to oscillate between 0 and 1.
  @t_inc = t_inc.abs if t <= 0
  @t_inc = t_inc.abs * -1 if t >=1
  @t += t_inc
  # The lerp method is used to animate between the top and bottom of the window.
  # The Ease methods are used to modify t to give a non-linear value between 0 and 1.
  # Animation oscillates between the top and bottom of the window, so the t_inc value
  # which will be positive when moving up and negative when moving down, is used to
  # control the direction of the asymmetric easing functions.
  (ease_style == LINEAR) ? fill(220, 160, 160) : fill(240)
  ellipse(RADIUS, lerp(height - RADIUS, RADIUS,t), RADIUS * 2, RADIUS * 2)
  (ease_style == SIN_IN) ? fill(220, 160, 160) : fill(240)
  ellipse(4 * RADIUS, lerp(height - RADIUS, RADIUS, Ease.sinIn(t, t_inc)), RADIUS * 2, RADIUS * 2)
  (ease_style == CUBIC_IN) ? fill(220, 160, 160) : fill(240)
  ellipse(7 * RADIUS, lerp(height - RADIUS, RADIUS, Ease.cubicIn(t, t_inc)), RADIUS * 2, RADIUS * 2)
  (ease_style == QUARTIC_IN) ? fill(220, 160, 160) : fill(240)
  ellipse(10 * RADIUS, lerp(height - RADIUS, RADIUS, Ease.quarticIn(t, t_inc)), RADIUS * 2, RADIUS * 2)
  (ease_style == QUINTIC_IN) ?  fill(220, 160, 160) : fill(240)
  ellipse(13 * RADIUS, lerp(height - RADIUS, RADIUS, Ease.quinticIn(t, t_inc)), RADIUS * 2, RADIUS * 2)
  (ease_style == SIN_OUT) ? fill(220, 160, 160) : fill(240)
  ellipse(16 * RADIUS, lerp(height - RADIUS, RADIUS, Ease.sinOut(t, t_inc)), RADIUS * 2, RADIUS * 2)
  (ease_style == CUBIC_OUT) ? fill(220, 160, 160) : fill(240)
  ellipse(19 * RADIUS, lerp(height - RADIUS, RADIUS, Ease.cubicOut(t, t_inc)), RADIUS * 2, RADIUS * 2)
  (ease_style == QUARTIC_OUT) ? fill(220, 160, 160) : fill(240)
  ellipse(22 * RADIUS, lerp(height - RADIUS, RADIUS, Ease.quarticOut(t, t_inc)), RADIUS * 2, RADIUS * 2)
  (ease_style == QUINTIC_OUT) ? fill(220, 160, 160) : fill(240)
  ellipse(25 * RADIUS, lerp(height - RADIUS, RADIUS, Ease.quinticOut(t, t_inc)), RADIUS * 2, RADIUS * 2)
  (ease_style == SIN_BOTH) ? fill(220, 160, 160) : fill(240)
  ellipse(28 * RADIUS, lerp(height - RADIUS, RADIUS, Ease.sinBoth(t)), RADIUS * 2, RADIUS * 2)
  (ease_style == CUBIC_BOTH) ? fill(220, 160, 160) : fill(240)
  ellipse(31 * RADIUS, lerp(height - RADIUS, RADIUS, Ease.cubicBoth(t)), RADIUS * 2, RADIUS * 2)
  (ease_style == QUARTIC_BOTH) ? fill(220, 160, 160) : fill(240)
  ellipse(34 * RADIUS, lerp(height - RADIUS, RADIUS, Ease.quarticBoth(t)), RADIUS * 2, RADIUS * 2)
  (ease_style == QUINTIC_BOTH) ? fill(220, 160, 160) : fill(240)
  ellipse(37 * RADIUS, lerp(height - RADIUS, RADIUS, Ease.quinticBoth(t)), RADIUS * 2, RADIUS * 2)
  (ease_style == BOUNCE_OUT) ? fill(220, 160, 160) : fill(240)
  ellipse(40 * RADIUS, lerp(height - RADIUS, RADIUS, Ease.bounceOut(t, t_inc)), RADIUS * 2, RADIUS * 2)
  (ease_style == ELASTIC_IN) ? fill(220, 160, 160) : fill(240)
  ellipse(43 * RADIUS, lerp(height - RADIUS, RADIUS, Ease.elasticIn(t)), RADIUS * 2, RADIUS * 2)
  # Draws a graph of the currently selected easing function.
  draw_graph
end

# ------------------ Processing key handling --------------------

# Responds to key presses. Left and right arrows control which easing function is to
# be highlighted and graphed. The up and down arrows control the speed of animation.
# The space bar pauses or unpauses the animation.
def key_pressed
  if key == ' '
    @is_paused = !is_paused
    is_paused ? no_loop : loop
  end
  return unless key == CODED
  # Up and down arrows control the speed of animation.
  case key_code
  when UP
    @t_inc *= 1.1
  when DOWN
    @t_inc *= 0.9
    # Left and right arrows highlight a particular easing style
  when RIGHT
    @ease_style += 1
    @ease_style = LINEAR if ease_style > ELASTIC_IN
  when LEFT
    @ease_style -= 1
    @ease_style = ELASTIC_IN if ease_style < LINEAR
  else
    return
  end
end

# ------------------ Private methods--------------------

# Draws a graph of the currently selected easing function.
def draw_graph
  push_style # Store previously used drawing styles.
  stroke(150)
  fill(150)
  stroke_weight(3)
  @origin = Vect.new(width - GRAPH_SIZE - RADIUS, height - 30)
  # Draw labelled axes.
  line(origin.x, origin.y, origin.x + GRAPH_SIZE, origin.y)
  line(origin.x, origin.y, origin.x, origin.y - GRAPH_SIZE)
  text('time', origin.x + GRAPH_SIZE, origin.y + 5)
  push_matrix
  translate(origin.x - 24, origin.y - GRAPH_SIZE)
  rotate(-HALF_PI)
  text('distance', 0, 0)
  pop_matrix
  # Draw transformation function.
  old_x = 0
  old_y = 0
  stroke(150)
  stroke_weight(0.5)
  y = 0
  px = t
  py = 0
  case ease_style
  when LINEAR
    text('Linear (no easing)', width - RADIUS, RADIUS)
    (0.01...1).step(0.01) do |x|
      y = x
      line(origin.x + old_x * GRAPH_SIZE, origin.y - old_y * GRAPH_SIZE, origin.x + x * GRAPH_SIZE, origin.y - y * GRAPH_SIZE)
      old_x = x
      old_y = y
    end
    py = px
  when SIN_IN
    text('sinIn', width - RADIUS, RADIUS)
    (0.01...1).step(0.01) do |x|
      y = Ease.sinIn(x, t_inc)
      line(origin.x + old_x * GRAPH_SIZE, origin.y - old_y * GRAPH_SIZE, origin.x + x * GRAPH_SIZE, origin.y - y * GRAPH_SIZE)
      old_x = x
      old_y = y
    end
    py = Ease.sinIn(px, t_inc)
  when CUBIC_IN
    text('cubicIn', width - RADIUS, RADIUS)
    (0.01...1).step(0.01) do |x|
      y = Ease.cubicIn(x,t_inc)
      line(origin.x + old_x * GRAPH_SIZE, origin.y - old_y * GRAPH_SIZE, origin.x + x * GRAPH_SIZE, origin.y - y * GRAPH_SIZE)
      old_x = x
      old_y = y
    end
    py = Ease.cubicIn(px, t_inc)
  when QUARTIC_IN
    text('quarticIn', width - RADIUS, RADIUS)
    (0.01...1).step(0.01) do |x|
      y = Ease.quarticIn(x, t_inc)
      line(origin.x + old_x * GRAPH_SIZE, origin.y - old_y * GRAPH_SIZE, origin.x + x * GRAPH_SIZE, origin.y - y * GRAPH_SIZE)
      old_x = x
      old_y = y
    end
    py = Ease.quarticIn(px, t_inc)
  when QUINTIC_IN
    text('quinticIn', width - RADIUS, RADIUS)
    (0.01...1).step(0.01) do |x|
      y = Ease.quinticIn(x, t_inc)
      line(origin.x + old_x * GRAPH_SIZE, origin.y - old_y * GRAPH_SIZE, origin.x + x * GRAPH_SIZE, origin.y - y * GRAPH_SIZE)
      old_x = x
      old_y = y
    end
    py = Ease.quinticIn(px, t_inc)
  when SIN_OUT
    text('sinOut', width - RADIUS, RADIUS)
    (0.01...1).step(0.01) do |x|
      y = Ease.sinOut(x, t_inc)
      line(origin.x + old_x * GRAPH_SIZE, origin.y - old_y * GRAPH_SIZE, origin.x + x * GRAPH_SIZE, origin.y - y * GRAPH_SIZE)
      old_x = x
      old_y = y
    end
    py = Ease.sinOut(px, t_inc)
  when CUBIC_OUT
    text('cubicOut', width, RADIUS, RADIUS)
    (0.01..1).step(0.01) do |x|
      y = Ease.cubicOut(x, t_inc)
      line(origin.x + old_x * GRAPH_SIZE, origin.y - old_y * GRAPH_SIZE, origin.x + x * GRAPH_SIZE, origin.y - y * GRAPH_SIZE)
      old_x = x
      old_y = y
    end
    py = Ease.cubicOut(px, t_inc)
  when QUARTIC_OUT
    text('quarticOut', width - RADIUS, RADIUS)
    (0.01...1).step(0.01) do |x|

      y = Ease.quarticOut(x, t_inc)
      line(origin.x + old_x * GRAPH_SIZE, origin.y - old_y * GRAPH_SIZE, origin.x + x * GRAPH_SIZE, origin.y - y * GRAPH_SIZE)
      old_x = x
      old_y = y
    end
    py = Ease.quarticOut(px, t_inc)
  when QUINTIC_OUT
    text('quinticOut', width, RADIUS, RADIUS)
    (0.01..1).step(0.01) do |x|
      y = Ease.quinticOut(x, t_inc)
      line(origin.x + old_x * GRAPH_SIZE, origin.y - old_y * GRAPH_SIZE, origin.x + x * GRAPH_SIZE, origin.y - y * GRAPH_SIZE)
      old_x = x
      old_y = y
    end
    py = Ease.quinticOut(px, t_inc)
  when SIN_BOTH
    text('sinBoth', width, RADIUS, RADIUS)
    (0.01...1).step(0.01) do |x|
      y = Ease.sinBoth(x)
      line(origin.x + old_x * GRAPH_SIZE, origin.y - old_y * GRAPH_SIZE, origin.x + x * GRAPH_SIZE, origin.y - y * GRAPH_SIZE)
      old_x = x
      old_y = y
    end
    py = Ease.sinBoth(px)
  when CUBIC_BOTH
    text('cubicBoth', width, RADIUS, RADIUS)
    (0.01...1).step(0.01) do |x|
      y = Ease.cubicBoth(x)
      line(origin.x + old_x * GRAPH_SIZE, origin.y - old_y * GRAPH_SIZE, origin.x + x * GRAPH_SIZE, origin.y - y * GRAPH_SIZE)
      old_x = x
      old_y = y
    end
    py = Ease.cubicBoth(px)
  when QUARTIC_BOTH
    text('quarticBoth', width, RADIUS, RADIUS)
    (0.01...1).step(0.01) do |x|
      y = Ease.quarticBoth(x)
      line(origin.x + old_x * GRAPH_SIZE, origin.y - old_y * GRAPH_SIZE, origin.x + x * GRAPH_SIZE, origin.y - y * GRAPH_SIZE)
      old_x = x
      old_y = y
    end
    py = Ease.quarticBoth(px)
  when QUINTIC_BOTH
    text('quinticBoth', width, RADIUS, RADIUS)
    (0.01...1).step(0.01) do |x|
      y = Ease.quinticBoth(x)
      line(origin.x + old_x * GRAPH_SIZE, origin.y - old_y * GRAPH_SIZE, origin.x + x * GRAPH_SIZE, origin.y - y * GRAPH_SIZE)
      old_x = x
      old_y = y
    end
    py = Ease.quinticBoth(px)
  when BOUNCE_OUT
    text('bounceOut', width - RADIUS, RADIUS)
    (0.01...1).step(0.01) do |x|
      y = Ease.bounceOut(x, t_inc)
      line(origin.x + old_x * GRAPH_SIZE, origin.y - old_y * GRAPH_SIZE, origin.x + x * GRAPH_SIZE, origin.y - y * GRAPH_SIZE)
      old_x = x
      old_y = y
    end
    py = Ease.bounceOut(px, t_inc)
  when ELASTIC_IN
    text('elasticIn', width - RADIUS, RADIUS)
    (0.01...1).step(0.01) do |x|
      y = Ease.elasticIn(x)
      line(origin.x + old_x * GRAPH_SIZE, origin.y - old_y * GRAPH_SIZE, origin.x + x * GRAPH_SIZE, origin.y - y * GRAPH_SIZE)
      old_x = x
      old_y = y
    end
    py = Ease.elasticIn(px)
  end
  # Draw the disc's current position on the graph.
  no_stroke
  fill(220, 160, 160)
  ellipse(origin.x + px * GRAPH_SIZE, origin.y - py * GRAPH_SIZE, 10, 10)
  stroke(220, 160, 160)
  line(origin.x + px * GRAPH_SIZE, origin.y - py * GRAPH_SIZE, origin.x + px * GRAPH_SIZE, origin.y)
  line(origin.x + px * GRAPH_SIZE, origin.y - py * GRAPH_SIZE, origin.x, origin.y - py * GRAPH_SIZE)
  pop_style # Restores previously used drawing styles.
end

private :draw_graph